proven at Reinis
25–35%
fewer kilometres per route.
less co₂.
less co₂.
real-time fill levelsAI forecastsdynamic routingone platform
the new pressure on the sector
If you do what you did,
you'll get what you got.
Most waste collection companies still run on logistics systems from a different era. Fixed routes. Fixed days. Half-empty or overflowing containers. Side-placements, complaints, extra shifts, and ultimately higher costs and a weaker sense of safety.
No fixed routes
Just dynamic trips.
No assumptions
Just fact-based forecasts.
No guesswork
Just real-time fill-level insight.
how it works
From signal to route,
in three steps.
01
Sensors in every container
Ultrasonic fill-level sensors measure every 15 minutes and transmit via nb-iot.
02
AI predicts when full
Scoop combines historical data, weather, events and seasonal patterns per container.
03
Dynamic routes
Every morning the most efficient route is calculated per driver, automatically in the driver app.
what scoop changes
Fixed route or dynamic trip?
Same city, same containers, same driver. One day. See the difference.
every container, whether it's full or not
142 km
total distance
13
stops (incl. 6 half-empty)
5h 20m
driver time
what if we told you this is already reality?
Measurably smarter.
Proven at Reinis.
0–0%
fewer kilometres
faster response
0×
Faster response to filling containers vs. fixed planning.
side-placements
up to −0%
In comparable sensor deployments (industry benchmark).
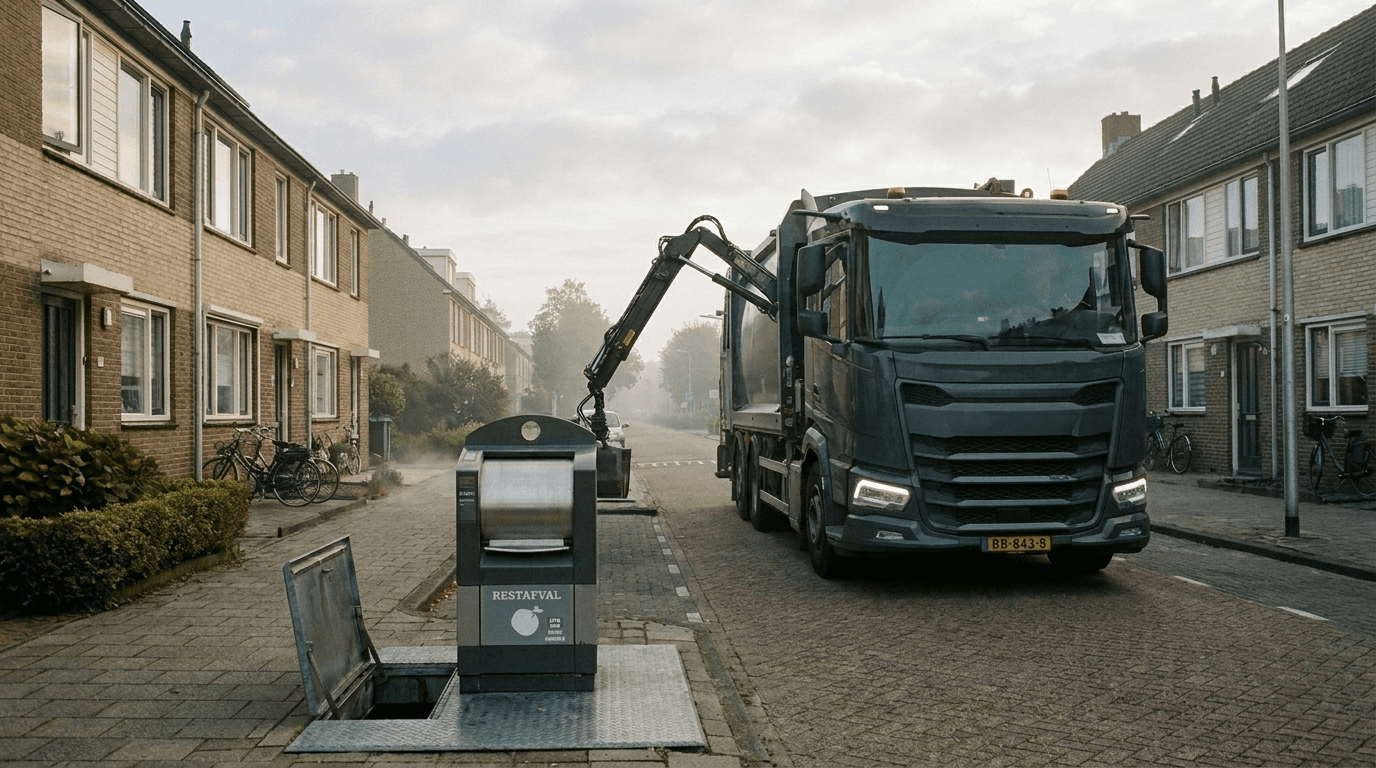
proven at Reinis, waste collector for the municipality of Nissewaard
real-time fill levels
Look inside a living district.
Every dot is a container. Every colour is the fill level, right now. The planner sees at a glance what needs to happen today.
28
36
58
78
62
92
81
22
95
55
74
40
North-west district
< 50%, ok
50–70%, monitor
70–90%, plan
> 90%, collect now
2
critical
3
high
3
medium
4
low
one platform · three surfaces
For the planner. For the driver.
For the data.
planner dashboard
The overview planners are missing.
Dynamic routes, anomalies, reporting, desktop-first, multilingual, connects with existing wms and erp.
driver app
trip · 08:42
3 / 12
next stop
Kerkplein 12
underground · residual · 92% full
620m3 min
container lid reported broken, 2 days ago
Big buttons.
Short trips.
Short trips.
Designed for the iPad on a dashboard, operable with gloves. Next stop, always in view.
the AI platform
Ask questions. Get routes.
Scoop's AI combines sensor history, weather and behavioural patterns. It answers in plain English. It plans in scenarios.
Scoop AI · planner
live · v1.4
ask scoop something…
Forecast per container
Every point gets its own model, based on history, weather, season, events.
Anomaly detection
Unexpected fillings or dead sensors are flagged automatically.
Conversational planning
Frame scenarios in plain language. Scoop answers with a map and a plan.
Reporting & accountability
Automatic monthly reports, co₂, kilometres, pickups, for the council and the board.
case · Reinis × municipality of Nissewaard
Fully rolled out at Reinis.
Every container, every trip.
"The friday-afternoon complaints inbox used to be my week.I opened it twice last month. That's the change i notice."
Edwin Bijker
managing director Reinis N.V.
−0%
kilometres driven
−0%
co₂ emissions (calculated from km)
0
overflows since go-live
up to −0%
side-placements · industry benchmark
secure & connected
Infrastructure, not a startup gamble.
Gdpr
Data processing agreement as standard. Dpia support per municipality.
99.95% uptime
Sla with backup operations plan, routes keep running, even during outages.
Open api
Rest + webhooks. Connects with wms, erp, bi and existing sensor manufacturers.
works with
waste systems
new wasteXLwasteSidconBammensEnevoEcube
sensors / iot
Mic-O-Dataams-iot
erp / bi
ms dynamicsAFASSAPpower bi
frequently asked questions
Everything you want to know,
before the demo.
plan a demo
Let us show you the kilometres
you'll save.
A 30-minute live demo on your own district data. We bring a planner and a driver back-seat.
Rotterdam · nl